Institution: H. Lee Moffitt Cancer Center
Additional authors:Xiaohui Zhang, M.D., Ling Zhang, M.D.
Session: Erythroleukemia and megakaryoblastic AML and mimics
HISTORY
The patient is a 49 year-old male with refractory anemia with excess blasts-2 (RAEB-2) and persistent transfusion-dependent cytopenias after 3 cycles of azacitidine plus lenalidomide. He was considered for allogeneic hematopoietic stem cell transplant and underwent induction chemotherapy with cladribine, cytarabine, GM-CSF and mitoxantrone (CLAG-M). Fourteen days later, a bone marrow biopsy showed residual cellularity, persistent dyspoiesis and increased blasts. A decision was made to re-induce with cladribine and cytarabine only (CLA), and a bone marrow biopsy was performed at day 14 post re-induction chemotherapy.
DETAILS
Prior bone marrow biopsies were reviewed (Figures 1 to 4). A bone marrow biopsy at diagnosis showed hypercelluarity, trilineage dysplasia, numerous monolobated megakaryocytes (Figure 1) and an expanded population of small CD34-positive myeloblasts accounting for 15% to 19% of the marrow cellularity (Figure 2). The morphologic findings on a bone marrow biopsy obtained after 3 cycles of azacitidine plus lenalidomide were essentially unchanged. At day 14 of first induction chemotherapy, a bone marrow biopsy showed 20% cellularity with numerous dyspoeitic megakaryocytes, dyspoietic maturing erythroids (Figure 3) and scattered myeloblasts accounting for 5% of the marrow cellularity (Figure 4). Re-induction with CLA was started and a bone marrow biopsy was obtained 14 days later. A complete blood count showed: Hb: 7.2 g/dL, MCV: 80fL, WBC: 0.16×10^6/μL, and platelets: 6×10^6/μL. Examination of a Wright-stained peripheral blood smear showed rare small lymphocytes and no blasts. Wright-stained bone marrow aspirates and touch imprints were markedly hypocellular, aparticulate and hemodilute. The bone marrow core biopsy was decalcified in 5% nitric acid, fixed in B-plus Fix (BBC Biochemical) and embedded in paraffin. H&E stained sections showed stromal damage and 30% cellularity comprised almost exclusively by large atypical cells with frequent multinucleation, powdery chromatin, prominent eosinophilic nucleoli, moderate amounts of amphophilic cytoplasm and frequent Reed-Sternberg-like bi-nucleated forms (Figures 5 and 6). Also identified were occasional atypical mitosis and few clusters of small cells with irregular hyperchromatic nuclei and hypereosinophilic cytoplasm (Figure 7).
IMMUNOHISTOCHEMISTRY AND FLOW CYTOMETRY
By immunohistochemistry, the large atypical cells were negative for CD34, CD45 and CD117 (Figures 8 and 9), bearing no resemblance to the small CD34-positive/CD117-positive/CD45-dim myeloblasts identified on prior bone marrow biopsies. Strong positivity for CD43 confirmed the hematolymphoid nature of the cells. Given the presence of multiple multinucleated forms, we entertained the possibility of a highly atypical megakaryocytic proliferation, as occasionally encountered following intense chemotherapy. Nevertheless, staining for CD61 and factor VIII was negative on the large atypical cells, highlighting only rare scattered residual megakaryocytes. Interestingly, additional immunohistochemical studies revealed strong positivity for Spectrin β1 (Figure 10), variable staining for glycophorin A (Figure 11) and partial positivity for hemoglobin A (Figure 12), consistent with an unusual and highly atypical proliferation of erythroid precursors.
CYTOGENETIC FINDINGS
FISH studies on the bone marrow aspirate obtained at diagnosis showed deletions of 5q, 7q and 20q.
Chromosomal analysis and FISH studies at day 14 post re-induction chemotherapy were not performed due to the hypocellular and hemodilute nature of the aspirate smears.
MOLECULAR FINDINGS
Not performed.
INTERESTING FEATURES
This case illustrates an exceedingly unusual proliferation of markedly dyspoietic erythroid precursors with morphologic features reminiscent of acute myeloid leukemia, Hodgkin lymphoma or carcinoma. Immunohistochemical studies and comparison with prior bone marrow biopsies were critical for the interpretation of these potentially deceiving morphological findings. Importantly, the atypical cells observed on this biopsy showed no morphologic or immunophenotypic resemblance to the expanded population of conventional CD34-positive/CD117-positive myeloblasts previously identified in this patient, making progression to acute myeloid leukemia an unlikely diagnosis. More over, the expression spectrin β1, glycophorin A and hemoglobin A on the large atypical cells unequivocally defined an erythroid lineage proliferation. In hind-sight, the occasional clusters of atypical small cells with hyperchromatin nuclei and hypereosinopilic cytoplasm (Figure 7), most likely represented aggregates atypical maturing erythroids with hemoglobinized cytoplasm, rather that apoptotic cells as initially thought. To our knowledge, this is the first case report demonstrating an extremely aberrant and potentially deceiving erythroid proliferation following induction chemotherapy. We hypothesize that this atypical erythroid proliferation resulted from a combination of underlying myelodysplastic erythropoiesis and a reaction to intense chemotherapy.
PROPOSED DIAGNOSIS
Original day 14 proposed diagnosis: Highly atypical proliferation of erythroid precursors post chemotherapy
Proposed diagnosis after integration of subsequent findings: Refractory anemia with excess blasts-2, RAEB-2, with rapid development of acute leukemia (pure erythroid leukemia) post-induction chemotherapy
CONSENSUS GROUP: ADDITIONAL INFORMATION/STUDIES
There were not enough metaphase obtained at the RAEB-2 diagnosis for meaningful karyotyping.
14 days before induction, the karyotype was 43-44,XY,dic(5;7)(q13;q22), dic(12;13)(p11.2;p11.2),-
16,add(17)(q25),add(21)(q22),+mar[cp20].
45 days post induction: the bone marrow showed pure erythroid leukemia. Karyotype showed 60,XY,+1,+2,add(4)(q31),+6,+6,+8,+8,+i(11)(q10),
+add(13)(p11.2),+add(14(p11.2),+19,+21,+21,+2mar, 2-3dmin[cp12]/46,XY[8]
CONSENSUS DIAGNOSIS
Erythroid predominant myeloid neoplasm:
Refractory anemia with excess blasts-2, RAEB-2, with rapid development of acute leukemia (pure erythroid leukemia) post-induction chemotherapy
| Figure 1. Bone marrow biopsy at diagnosis (H&E, 100x). Hypercellular bone marrow with abundant monolobated megakaryocytes, in a background of dysplastic maturing erythroids and granulocytes. |  |
| Figure 2. Bone marrow biopsy at diagnosis (CD34, 200x). Increased numbers of scattered small myeloblasts are highlighted by CD34 immunostain, accounting for 15% to 19% of the overall marrow cellularity. |  |
| Figure 3. Bone marrow biopsy at day 14 of first induction chemotherapy (H&E, 100x). The cellularity consists of dyspoietic megakaryocytes and erythroid precursors, in a background of chemotherapy-induced stromal damage. |  |
| Figure 4. Bone marrow biopsy at day 14 of first induction chemotherapy (CD34, 200x). Microphotograph of an area rich in small CD34-positive blasts. | 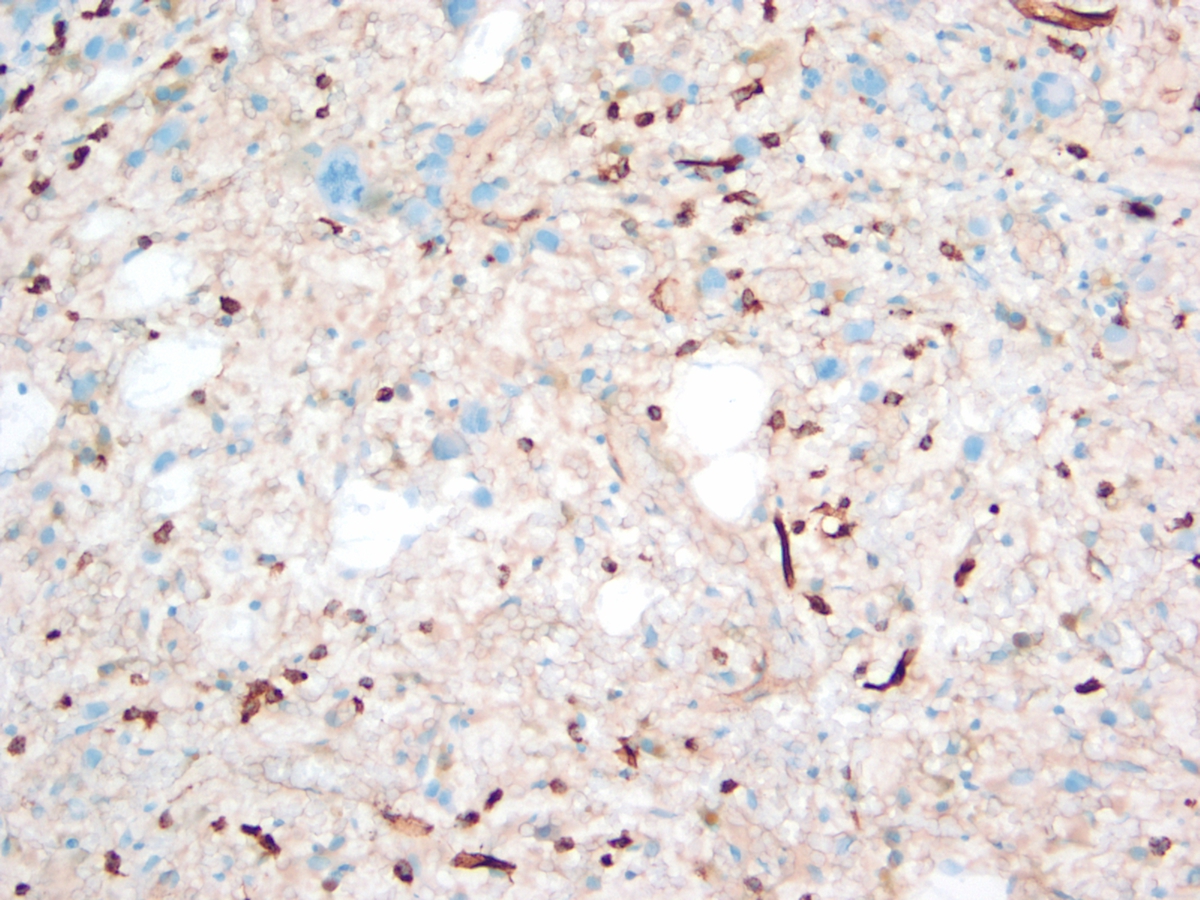 |
| Figure 5. Bone marrow biopsy at day 14 of second induction chemotherapy (H&E, 100x). The cellularity is comprised almost exclusively by abundant large atypical cells with frequent multinucleation, in a background of stromal damage. | 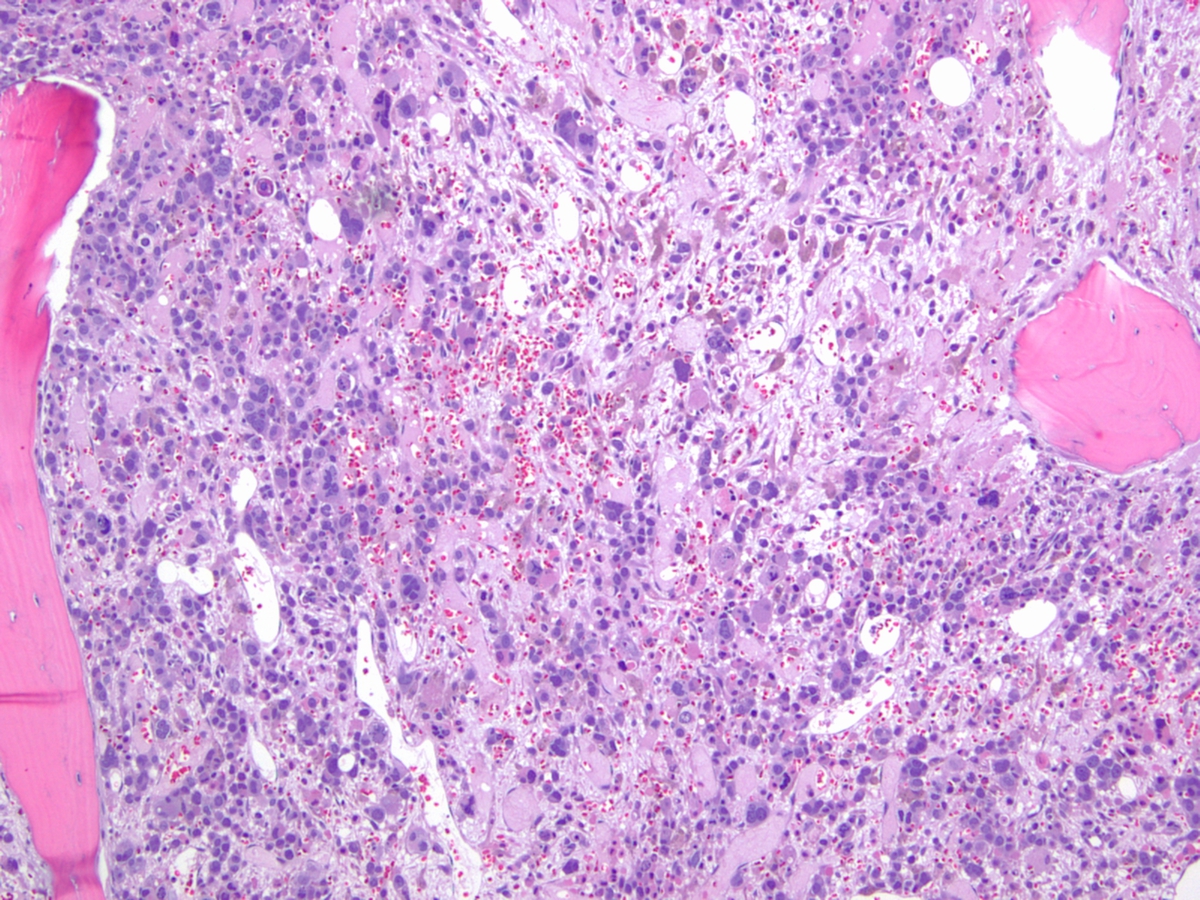 |
| Figure 6. Bone marrow biopsy at day 14 of second induction chemotherapy (H&E, 500x). Abundant large atypical cells with monolobated to polylobated nuclei, powdery chromatin, large prominent nucleoli and moderate amounts of amphophilic cytoplasm. Frequent Reed-Sternberg-like binucleated forms are observed. |  |
| Figure 7. Bone marrow biopsy at day 14 of second induction chemotherapy (H&E, 500x). High power field showing atypical mitotic figures (upper mid and upper right), in addition to multiple small cells with picnotic nuclei and hypereosinophilic cytoplasm. |  |
| Figure 8. Bone marrow biopsy at day 14 of second induction chemotherapy (CD34, 100x). CD34 highlights the endothelial cells and is negative on the large atypical cells. |  |
| Figure 9. Bone marrow biopsy at day 14 of second induction chemotherapy (CD45, 100x). CD45 highlights few scattered small lymphocytes and is negative on the large atypical cells. | 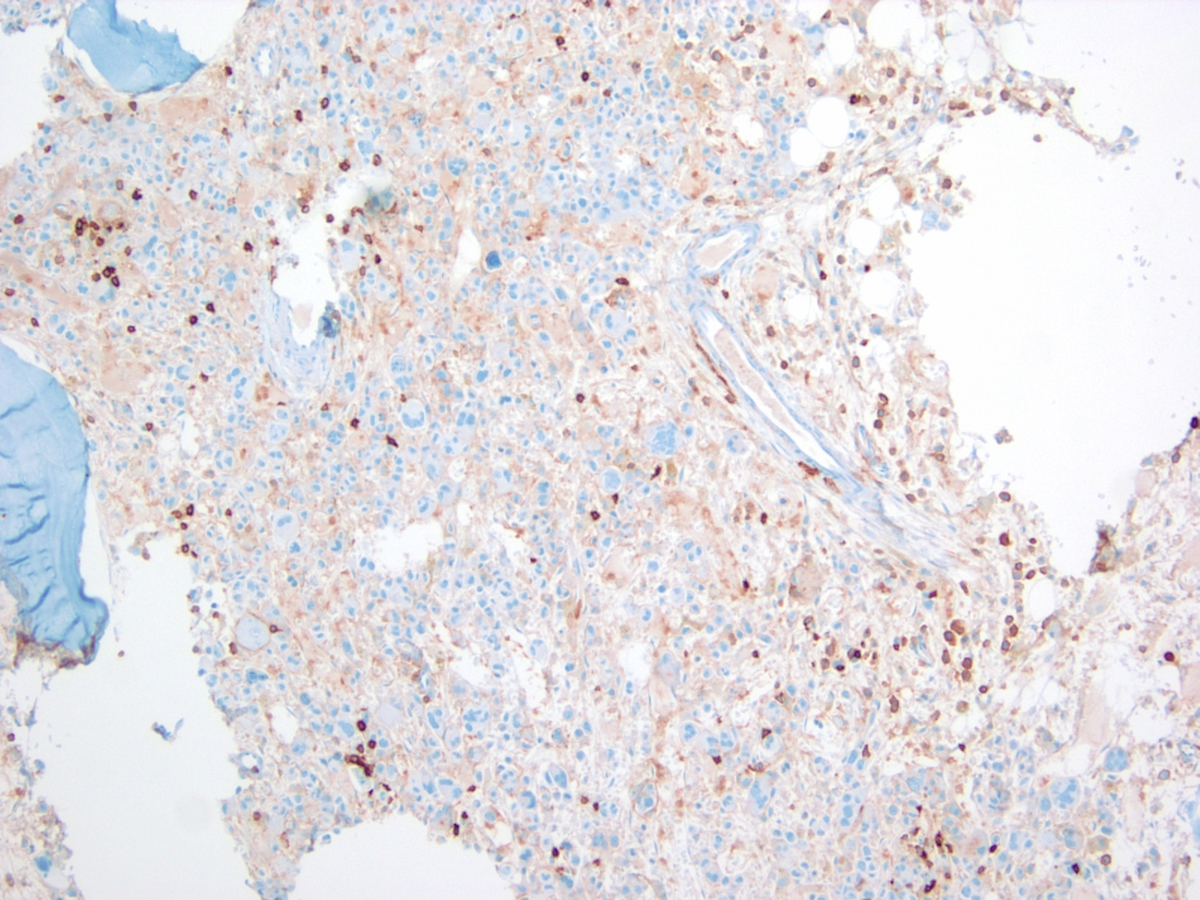 |
| Figure 10. Bone marrow biopsy at day 14 of second induction chemotherapy (Spectrin β1, 100x). Most of the bone marrow cellularity is strongly positive for spectrin β1. |  |
| Figure 11. Bone marrow biopsy at day 14 of second induction chemotherapy (Glycophorin A, 200x). Glycophorin A is variably positive on most nucleated cells. |  |
| Figure 12. Bone marrow biopsy at day 14 of second induction chemotherapy (Hemoglobin A, 200x). Variable weak staining for Hemoglobin A in a proportion of nucleated cells. |  |
| Additional figure 1: Summary | 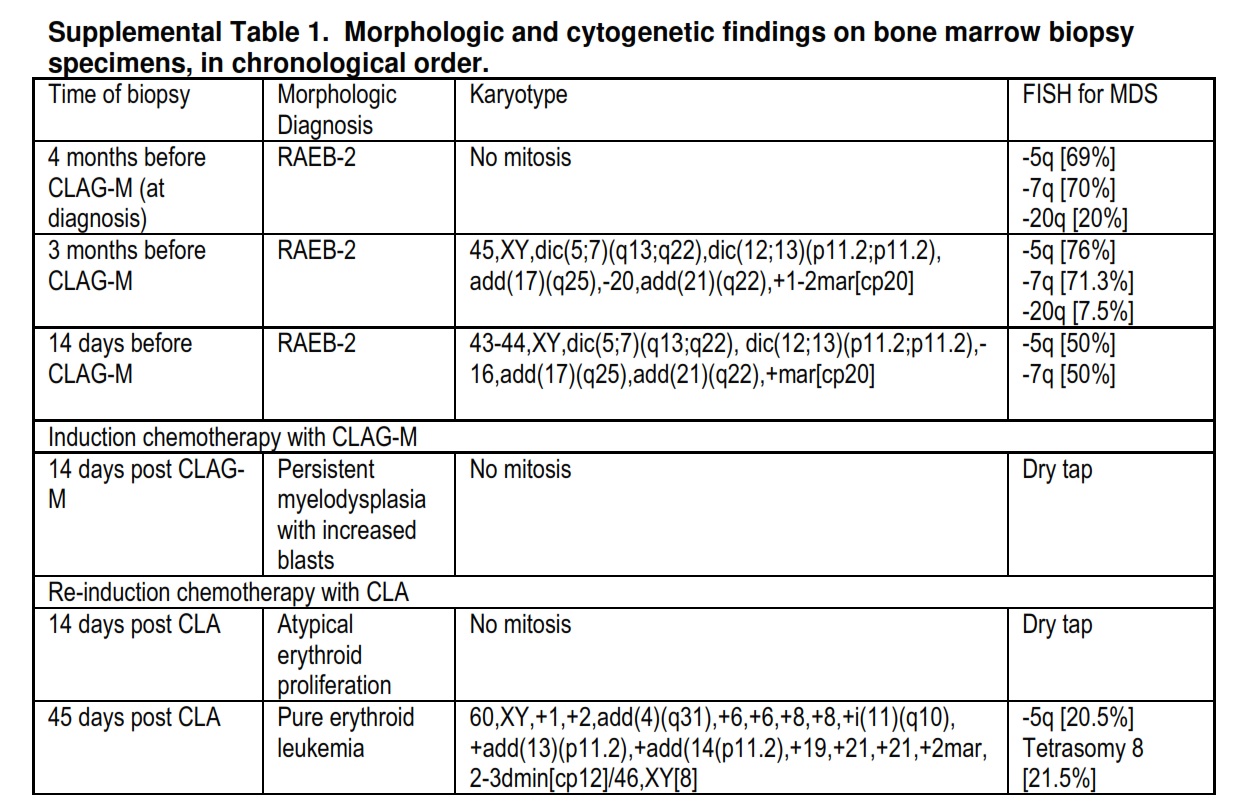 |