Institution: Department of Pathology & Immunology, Baylor College of Medicine and Texas Children’s Hospital, Houston, TX
Additional authors:Elias R. George, M.D., Andrea M. Sheehan, M.D., Jyotinder N. Punia, M.D.
Session: T Lymphoblastic Leukemia/Lymphoma
HISTORY
A 17-year-old male with no significant past medical history presented with new onset vomiting, diarrhea, and cough. On review of systems, the patient reported fatigue but no weight change, fevers, pallor, or easy bruising. His physical exam was unremarkable with no palpable lymphadenopathy or organomegaly. A complete blood count revealed a white blood cell (WBC) count of 52 x 10^3/µL with 73% blasts, hemoglobin 13.5 g/dL, hematocrit 39.5%, and platelets 165 x 10^3/µL. Lactate dehydrogenase was elevated at 2058 IU/L, and uric acid was elevated at 6.8 mg/dL. A lumbar puncture also revealed blasts in the cerebrospinal fluid (CSF). After diagnosis, the patient started induction chemotherapy with prednisone, vincristine, daunorubicin, and pegaspargase. Bone marrow specimens on days 8, 15, and 29 showed persistent leukemia. Given the poor response to initial therapy and the leukemia subtype, the patient was deemed high-risk and placed on intensive consolidation therapy including nelarabine, 6-mercaptopurine, cytarabine, cyclophosphamide, vincristine, intrathecal methotrexate, and pegaspargase. However, the patient continued to show low level involvement by leukemia and is being considered for allogeneic stem cell transplantation.
DETAILS
The peripheral blood smear and bone marrow core biopsy (decalcified in Cal-Ex II (Fisher Scientific) and fixed in 10% neutral buffered formalin), clot (fixed in 10% neutral buffered formalin), and aspirate smears of the right posterior iliac crest are reviewed. The peripheral blood smear shows leukocytosis (WBC count = 47 x 10^3/µL) with 85% of the WBC differential consisting of blasts of medium to large size with high nuclear to cytoplasmic ratios, scant to moderate cytoplasm, round to irregular nuclear contours, dispersed chromatin, and occasional distinct nucleoli. The bone marrow core biopsy and clot sections display similar findings consisting of hypercellular marrow with a cellularity of 95%, the majority of which is replaced by sheets of immature cells. Background trilineage hematopoiesis is markedly decreased consisting of residual scattered erythroid precursors, megakaryocytes, eosinophils, and few myeloid precursors. The aspirate smears show markedly increased blasts (88%) morphologically similar to those seen in the peripheral blood. Rare residual myeloid and erythroid precursors are present, and the megakaryocytes are morphologically unremarkable.
IMMUNOHISTOCHEMISTRY AND FLOW CYTOMETRY
Immunohistochemistry performed on the bone marrow clot sections shows the immature cells are positive for CD3 (70%, weak to strong), CD7 (90%), and TdT (50%), and are negative for CD1a and myeloperoxidase (MPO). Flow cytometric analysis performed on the peripheral blood shows a blast population (85%) positive for CD45 (moderate), CD7, CD11b, CD34, CD117 (partial), CD58 (partial), CD71 (partial), CD38, cytoplasmic CD3 (very dim, subset), and TdT (very dim, subset), and notably negative for CD2, CD5, CD4, CD8, and MPO. Two blast population subsets are identified: subset one is positive for HLA-DR, CD34 (dim to negative), CD117 (dim), CD11b (dim), and negative for CD99 and CD33, and subset two is positive for CD99, CD34 (brighter), CD33 (dim partial), CD11b, and negative for CD117 and HLA-DR.
CYTOGENETIC FINDINGS
Chromosome and fluorescence in situ hybridization analyses of the bone marrow aspirate showed loss of one copy of the ABL1 gene and del(5q) with deletion of the 5q31 region.
MOLECULAR FINDINGS
Not performed.
INTERESTING FEATURES
Early T-cell precursor acute lymphoblastic leukemia (ETP-ALL) is a recently recognized, distinct biological entity associated with a poorer prognosis than typical T-cell acute lymphoblastic leukemia (T-ALL) and has a characteristic immunophenotype (CD1a-, CD8-, CD5 weak, with one or more stem-cell or myeloid markers), which aids in the diagnosis.(1) The overall features of this case support a diagnosis of ETP-ALL with an immunophenotype positive for cytoplasmic CD3, CD7, stem-cell markers CD34 and CD117 (partial), and myeloid markers CD11b and CD33 (dim partial, subset), but negative for CD1a, CD5, and CD8. Notably, the blasts are also positive for CD99 (subset) and TdT but are negative for MPO, the latter helping to exclude acute myeloid leukemia.
Proper diagnosis of this entity is important, as this disease is associated with a poor response to induction chemotherapy (as seen in our case), higher risk of relapse, and worse prognosis compared to typical T-ALL.(1) Alternative and/or more intensive treatment regimens may therefore be sought for cases of ETP-ALL. Allogeneic stem cell transplantation may also be considered, as it is in our case, since it has been indicated in recent studies this may improve outcome.(2,3)The diagnosis of ETP-ALL can be challenging in cases lacking surface T-cell lineage-specific antigens by flow cytometry with co-expression of myeloid and stem-cell markers, which may resemble acute myeloid leukemia. Recognition of this entity along with attention to the characteristic immunophenotype and utilization of select markers will allow for a proper diagnosis.References:1. Coustan-Smith E, Mullighan CG, Onciu M, et al. Early T-cell precursor leukaemia: a subtype of very high-risk acute lymphoblastic leukaemia. Lancet Oncol. 2009 Feb;10(2):147-56.2. Inukai T, Kiyokawa N, Campana D, et al. Clinical significance of early T-cell precursor acute lymphoblastic leukaemia: results of the Tokyo Children's Cancer Study Group Study L99-15. Br J Haematol. 2012 Feb;156(3):358-65.3. Neumann M, Coskun E, Fransecky L, et al. FLT3 Mutations in Early T-Cell Precursor ALL Characterize a Stem Cell Like Leukemia and Imply the Clinical Use of Tyrosine Kinase Inhibitors. PLoS One. 2013;8(1):e53190.PROPOSED DIAGNOSIS
Early T-cell precursor acute lymphoblastic leukemia
CONSENSUS DIAGNOSIS
T-acute lymphoblastic leukemia, early T-cell precursor immunophenotype
| Figure 1a: Peripheral blood smear highlighting blast morphology (1000x magnification). | 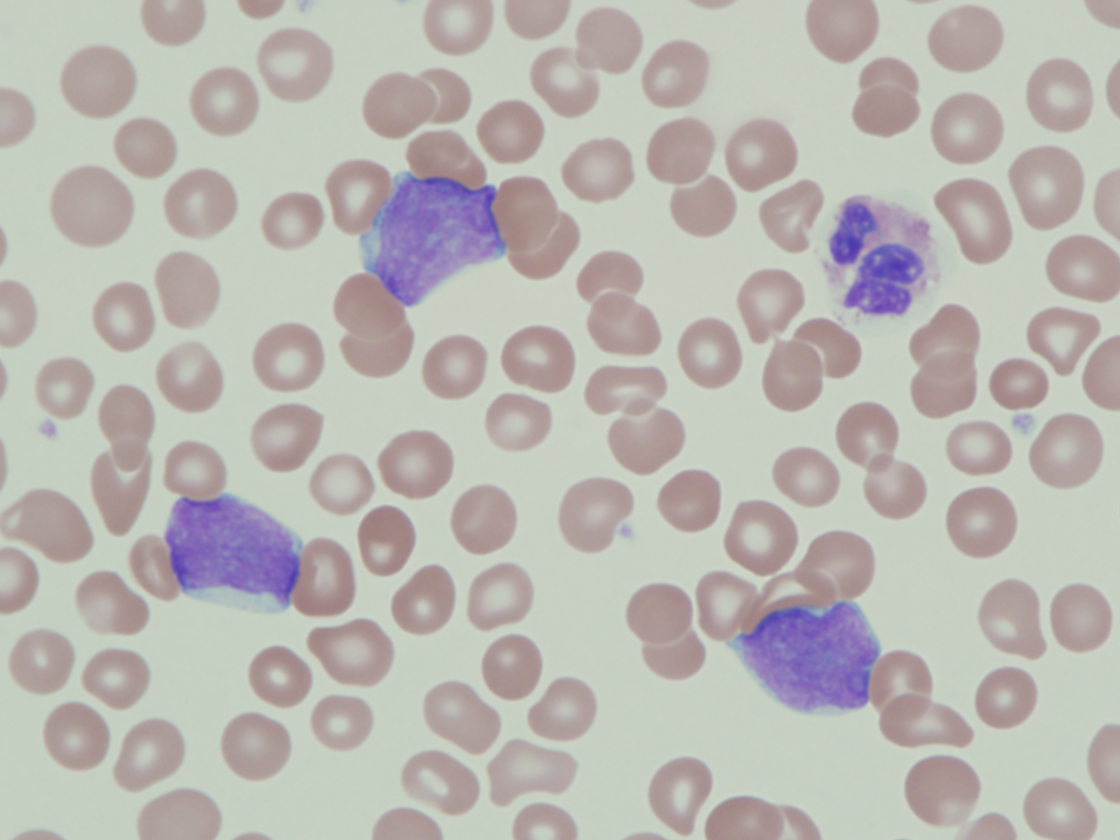 |
| Figure 1b: Peripheral blood smear highlighting blast morphology (1000x magnification). | 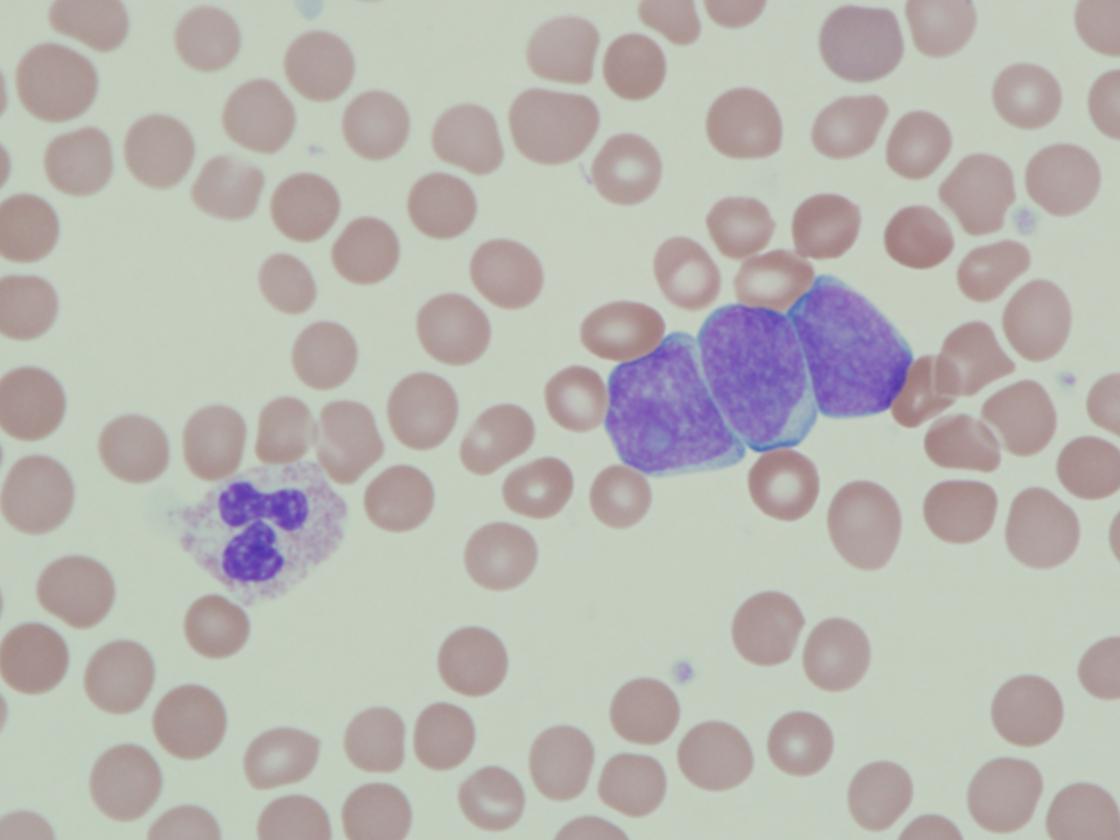 |
| Figure 1c: Peripheral blood smear highlighting blast morphology (1000x magnification). | 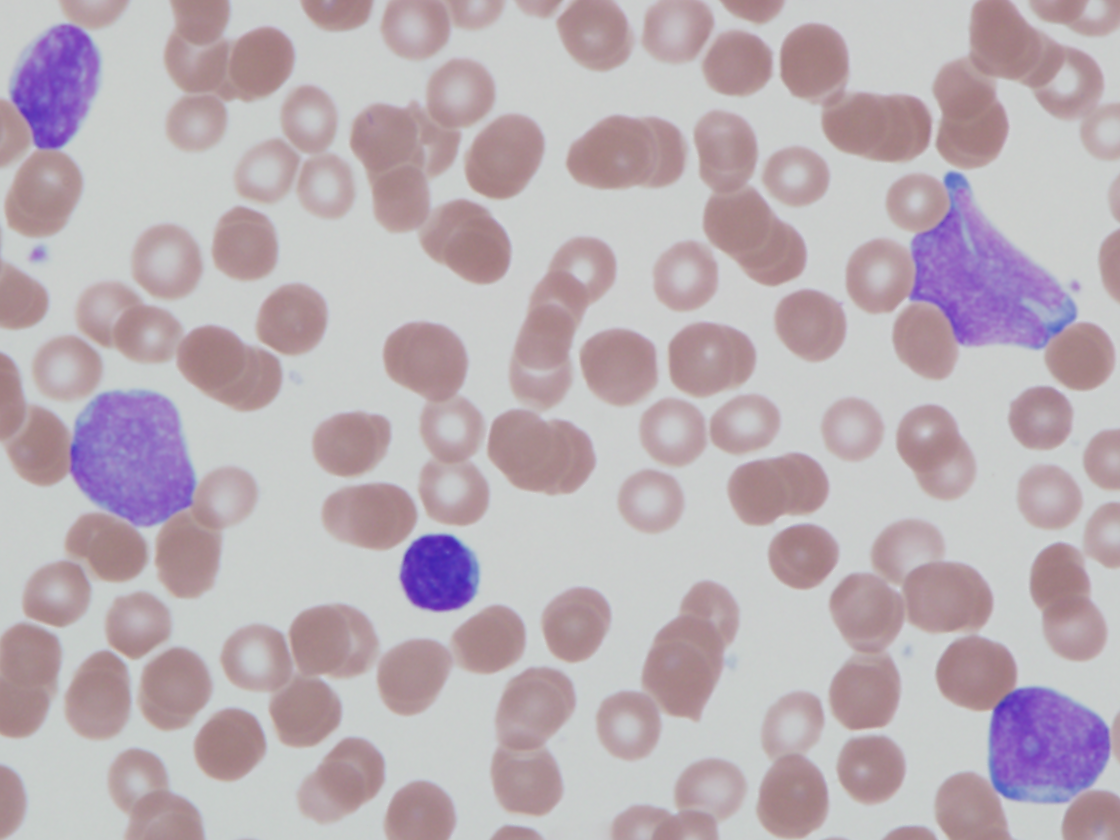 |
| Figure 1d: Peripheral blood smear highlighting blast morphology (1000x magnification). | 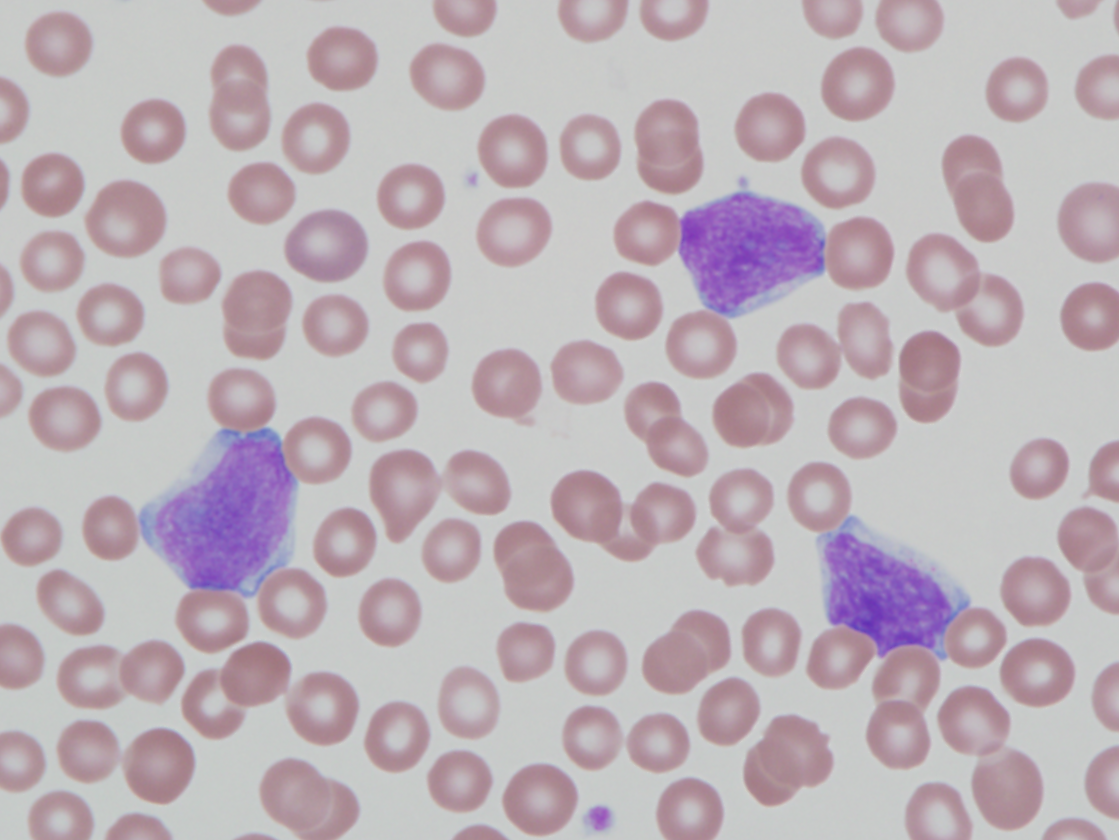 |
| Figure 2: Bone marrow aspirate smear with increased blasts (1000x magnification). | 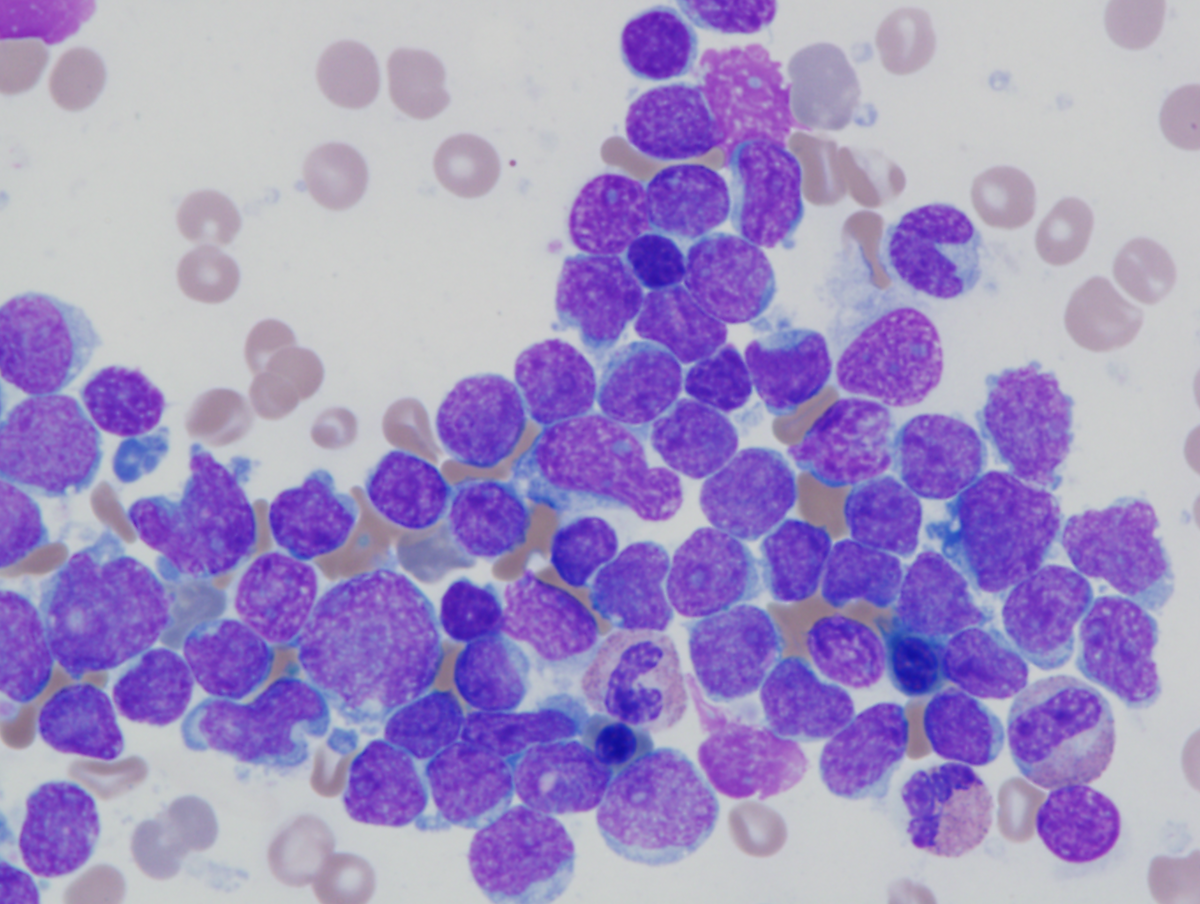 |
| Figure 3: Bone marrow core biopsy showing hypercellular marrow (100x magnification). | 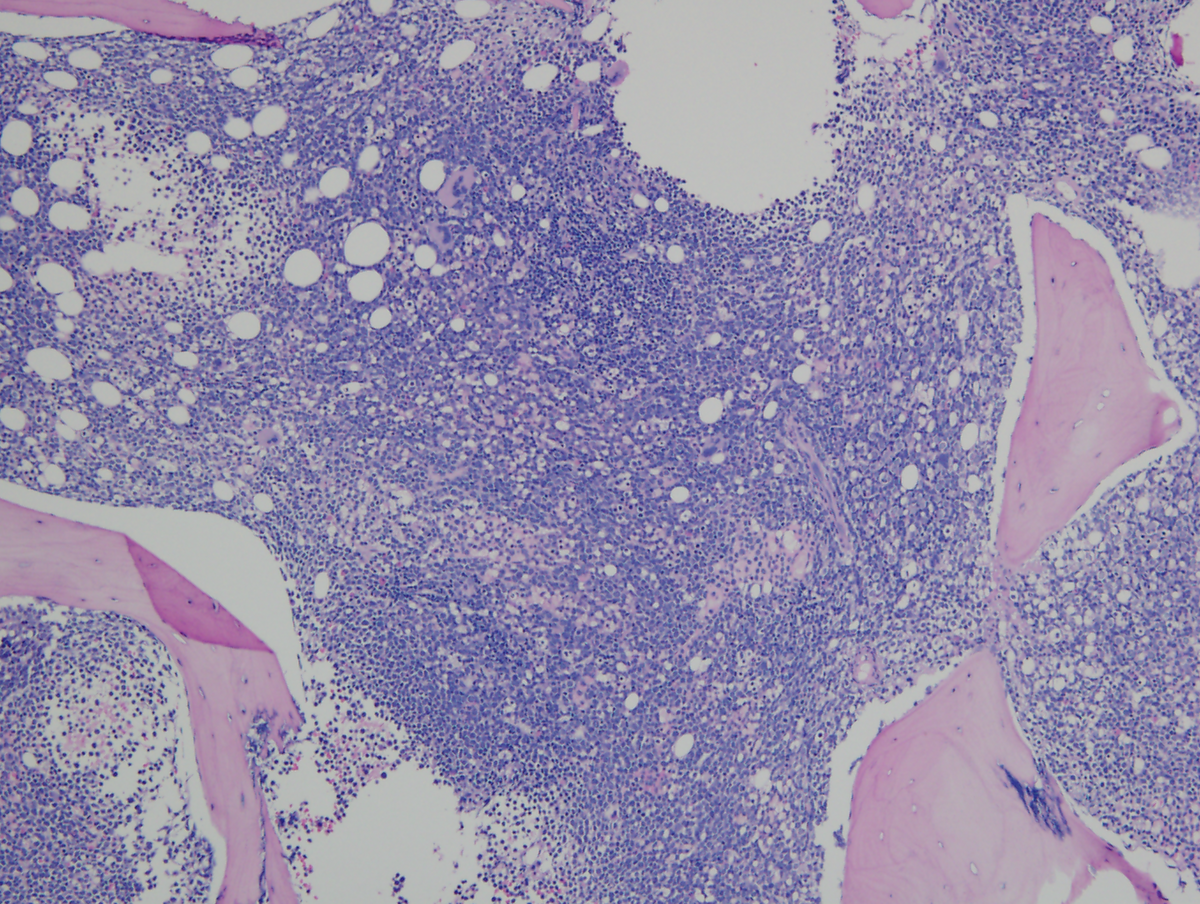 |
| Figure 4: Bone marrow core biopsy with sheets of immature cells (400x magnification). | 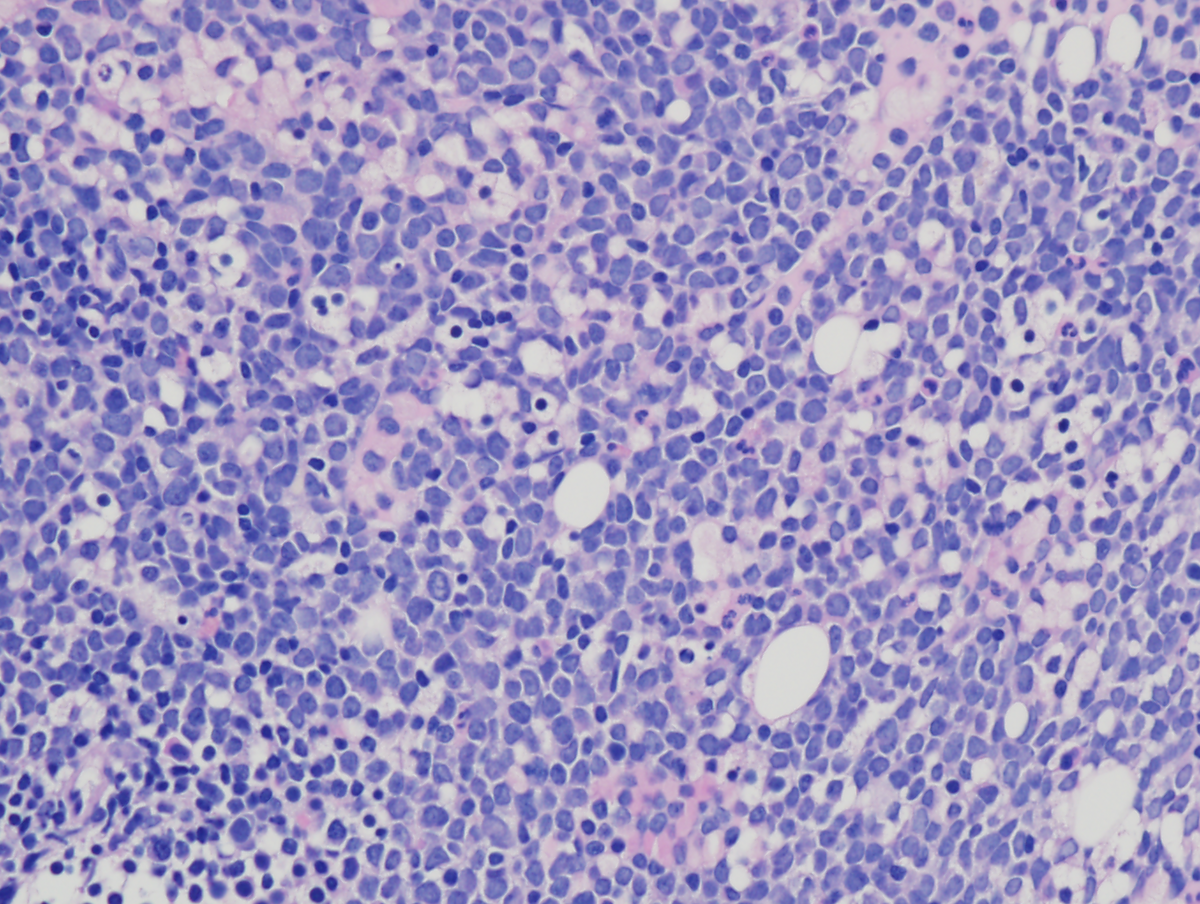 |
| Figure 5(CD3): Immunohistochemistry of bone marrow clot sections (400x magnification). | .png) |
| Figure 5(CD7): Immunohistochemistry of bone marrow clot sections (400x magnification). | .png) |
| Figure 5(TdT): Immunohistochemistry of bone marrow clot sections (400x magnification). | .png) |
| Figure 5(MPO): Immunohistochemistry of bone marrow clot sections (400x magnification). | .png) |
| Figure 6a: Flow cytometry, peripheral blood. Blasts (red) are CD45+ (moderate), CD7+, CD11b+, CD34+, and CD117+ (partial). Surface CD3 is negative. | 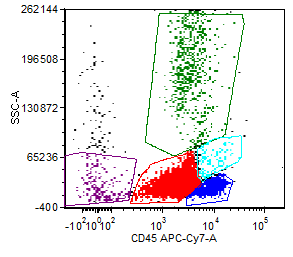 |
| Figure 6b: Flow cytometry, peripheral blood. Blasts (red) are CD45+ (moderate), CD7+, CD11b+, CD34+, and CD117+ (partial). Surface CD3 is negative. | 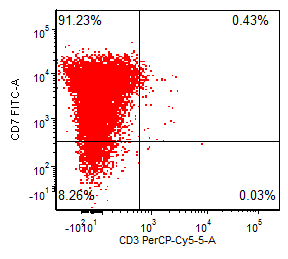 |
| Figure 6c: Flow cytometry, peripheral blood. Blasts (red) are CD45+ (moderate), CD7+, CD11b+, CD34+, and CD117+ (partial). Surface CD3 is negative. | 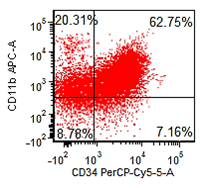 |
| Figure 6d: Flow cytometry, peripheral blood. Blasts (red) are CD45+ (moderate), CD7+, CD11b+, CD34+, and CD117+ (partial). Surface CD3 is negative. | 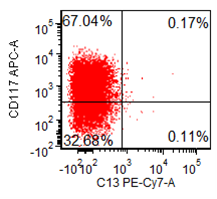 |
| Figure 7a: Flow cytometry (cont.). Two blast population subsets with differing HLA-DR and CD99 expression. Very dim cCD3 and TdT positive subsets are seen. Blasts are negative for MPO. | 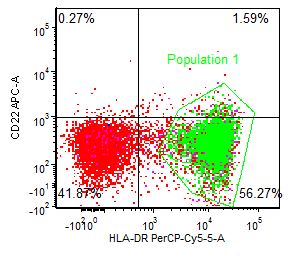 |
| Figure 7b: Flow cytometry (cont.). Two blast population subsets with differing HLA-DR and CD99 expression. Very dim cCD3 and TdT positive subsets are seen. Blasts are negative for MPO. | 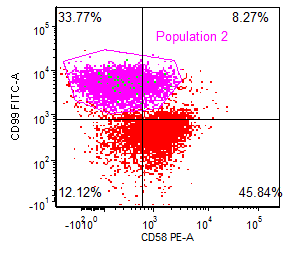 |
| Figure 7c: Flow cytometry (cont.). Two blast population subsets with differing HLA-DR and CD99 expression. Very dim cCD3 and TdT positive subsets are seen. Blasts are negative for MPO. | 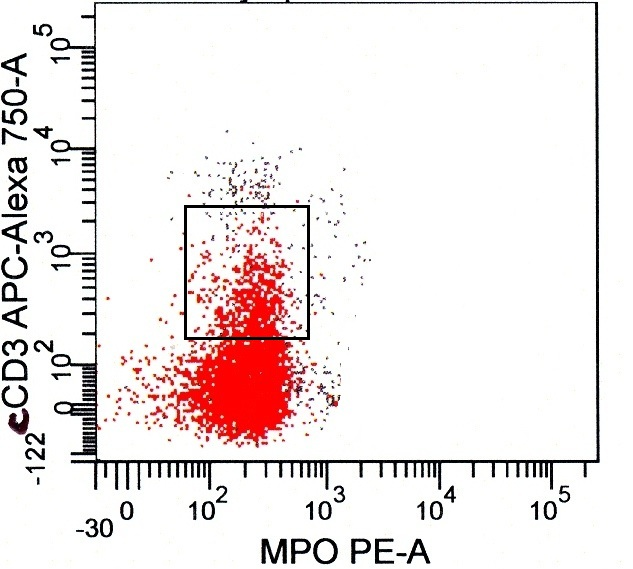 |
| Figure 7d: Flow cytometry (cont.). Two blast population subsets with differing HLA-DR and CD99 expression. Very dim cCD3 and TdT positive subsets are seen. Blasts are negative for MPO. | 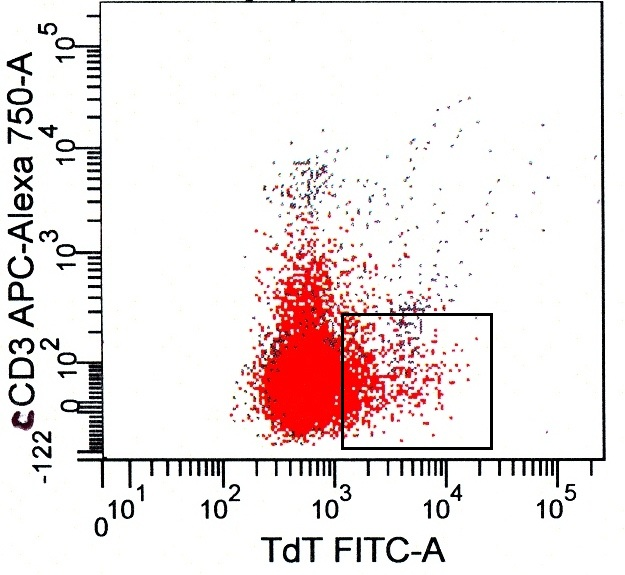 |