Institution: University of Pittsburgh Medical Center
Session: T Lymphoblastic Leukemia/Lymphoma
HISTORY
A 54-year-old woman was referred to our institution for leukocytosis, progressive fatigue associated with a fourteen pound weight loss. Multiple bilateral cervical, supraclavicular, axillary and inguinal lymph nodes were noted on exam. At presentation, the white cell count was 117 × 109/L with 39% blasts, 27% monocytes, hemoglobin 7.9 g/dL, platelets 150 × 109 /L and lactate dehydrogenase 827 U/L. Computer tomography of the abdomen revealed abdominal, mesenteric and periaortic lymphadenopathy, but no hepatosplenomegaly.
DETAILS
Left cervical lymph node biopsy demonstrated a lymphoid neoplasm with blastic morphology and focal aggregates of myeloid and/or monocytic immature cells (Images 1-3). The peripheral blood white cell count was markedly elevated (WBC=117.1 x10e9/L) with differential showing 39% lymphoid blasts, 27% monocytes, 33% neutrophils and neutrophilc precursors including myeloblasts and 1% lymphocytes. Morphologic evaluation of the peripheral blood smear demonstrated many small lymphoid blasts with high nuclear/cytoplasmic ratio and numerous monocytes (Images 4, 5). Bone marrow aspirate and biopsy revealed a hypercellular marrow with lymphoblastic infiltrate and many myeloid/monocytic precursors (Images 6, 7).
IMMUNOHISTOCHEMISTRY AND FLOW CYTOMETRY
Flow cytometric immunophenotypic analysis of the peripheral blood and bone marrow aspirate demonstrated two distinct populations.
The first was a T-lymphoid blast population which was positive for cytoplasmic CD3, CD5, CD7, CD1a and negative for surface CD3, CD34 and TdT.
The second population was characterized by the expression of CD14, CD36, CD64, bright CD33, CD4, HLA-DR and CD56 consistent with monocytes (Images 8-12).
Immunohistochemical stains showed scattered TdT positive cells in the bright CD7 positive, CD3 positive T-lymphoid infiltrate. The myeloid/monocytic infiltrate was CD68 positive, but TdT negative (Images 13-15).
CYTOGENETIC FINDINGS
Cytogenetic studies of the bone marrow aspirate demonstrated an abnormal clone with t(9;22)(q34;q11.2) and add(7)(q34). Interphase FISH analysis demonstrated BCR-ABL gene rearrangement in 92.5% of cells on direct preparation of peripheral blood (Image 16).
MOLECULAR FINDINGS
Quantitative PCR assay of the peripheral blood demonstrated BCR-ABL1 rearrangement with minor breakpoint cluster (m-bcr) resulting in a p190 fusion product.
INTERESTING FEATURES
The case described above presented with lymphadenopathy and high white cell count in the peripheral blood which was only in part due to the presence of blasts; there was a significant monocytic component in the peripheral blood and bone marrow at presentation. The monocytic population had a mature phenotype, but interphase FISH studies performed on the unstimulated peripheral blood showed that they are a component of the neoplastic clone. This clearly indicates a stem cell disorder with a multilineage involvement. There was no prior history of CML or peripheral blood leukocytosis. This case was difficult to classify as the blasts expressed multiple T lineage antigens with no evidence of myeloid (MPO) or B lineage specific antigens expression. The monocytic component was morphologically and phenotypically mature (non-blastic), but the monocytes were clearly a part of the dominant BCR-ABL1 positive clone.
PROPOSED DIAGNOSIS
Diagnosis:
Mixed phenotype acute leukemia with t(9;22) translocation BCR-ABL+
Differential diagnoses:
1. T-lymphoblastic leukemia/lymphoma; BCR-ABL1+, with excessive monocytosis
2. Chronic myelogenous leukemia in blast phase with excessive monocytosis (rare p190 BCR-ABL1+ variant)
CONSENSUS DIAGNOSIS
T-acute lymphoblastic leukemia/lymphoma; Philadelphia chromosome positive, p190 BCR-ABL1 variant, with monocytosis versus blastic phase (lymphoblastic) chronic myelogenous leukemia
| Image 1 Lymph node biopsy | 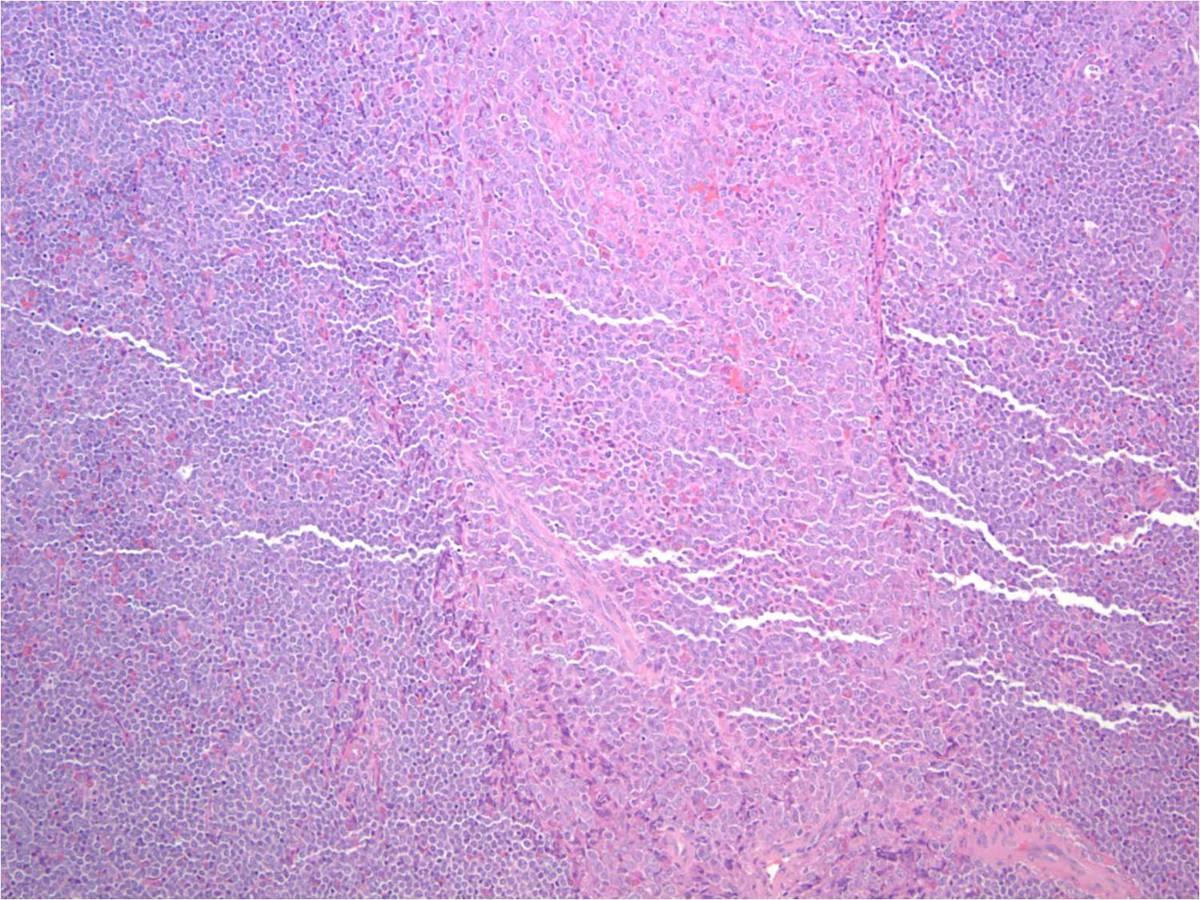 |
| Image 3 Lymph node biopsy - monocytic aggregate |  |
| Image 2 Lymph node biopsy - lymphoblastic infiltrate |  |
| Image 4 Peripheral Blood | 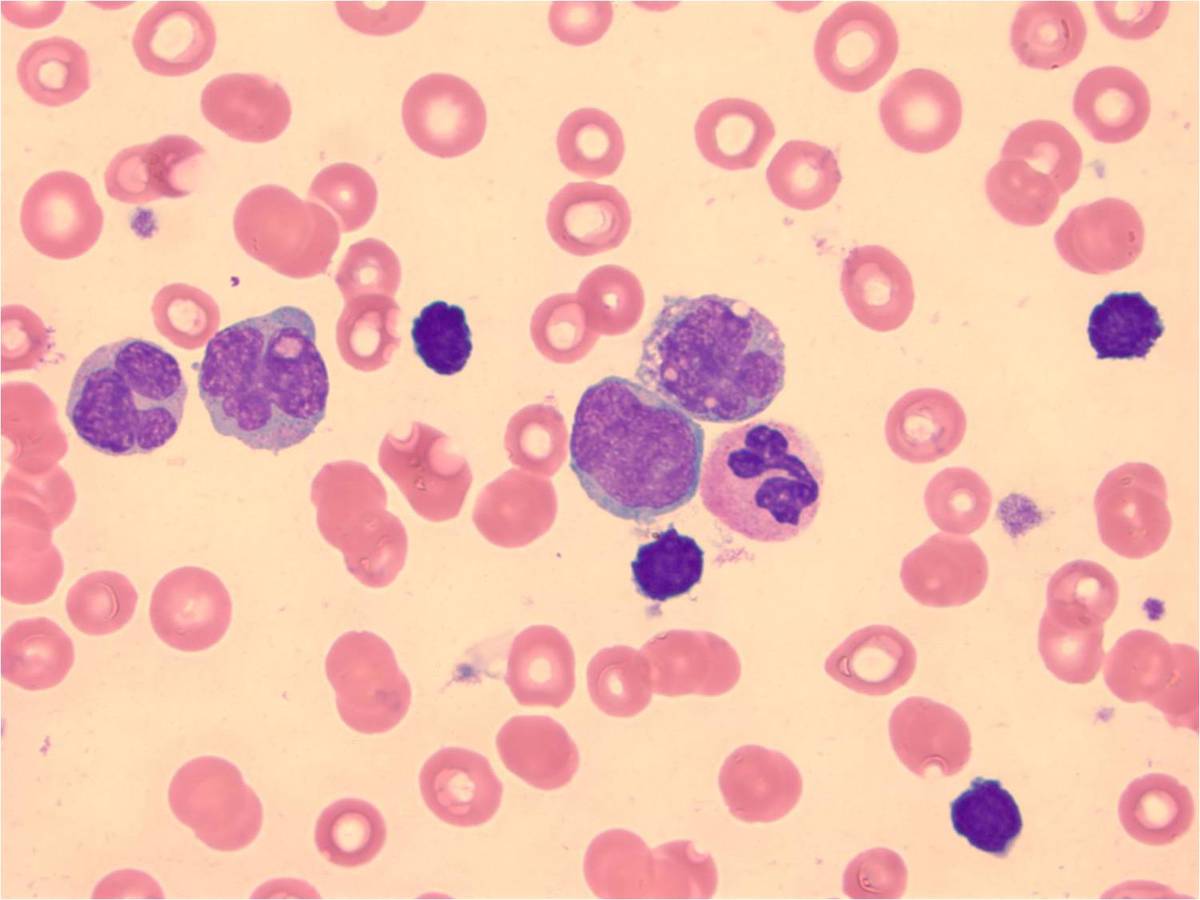 |
| Image 5 Peripheral Blood |  |
| Image 6 Bone marrow biopsy |  |
| Image 7 Bone marrow aspirate |  |
| Image 8 Flow cytometry | 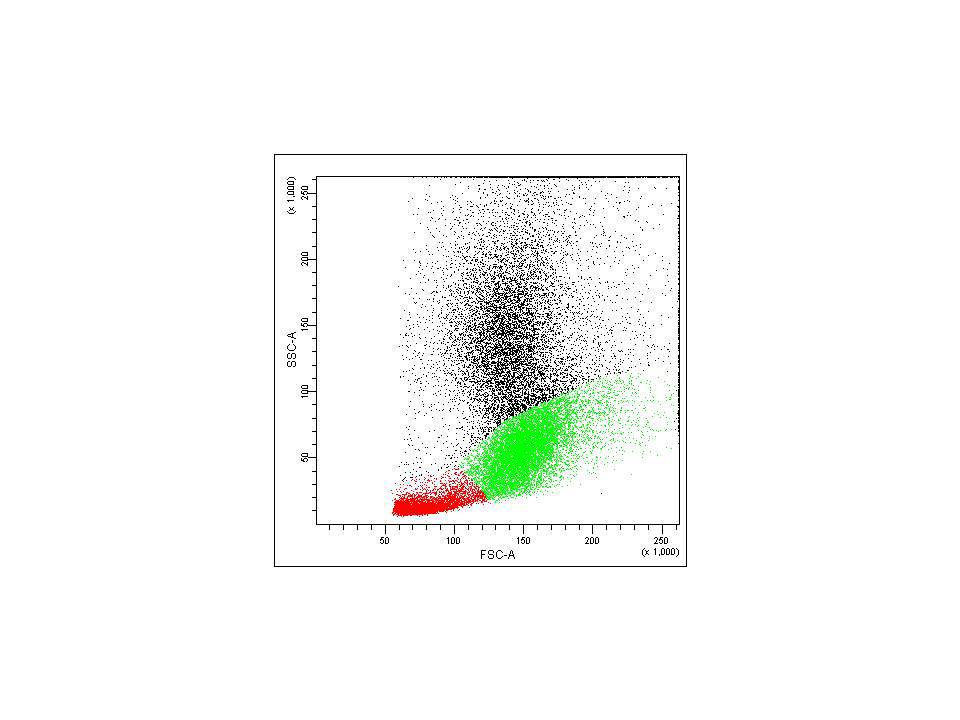 |
| Image 9 Flow cytometry |  |
| Image 10 Flow cytometry |  |
| Image 11 Flow cytometry | 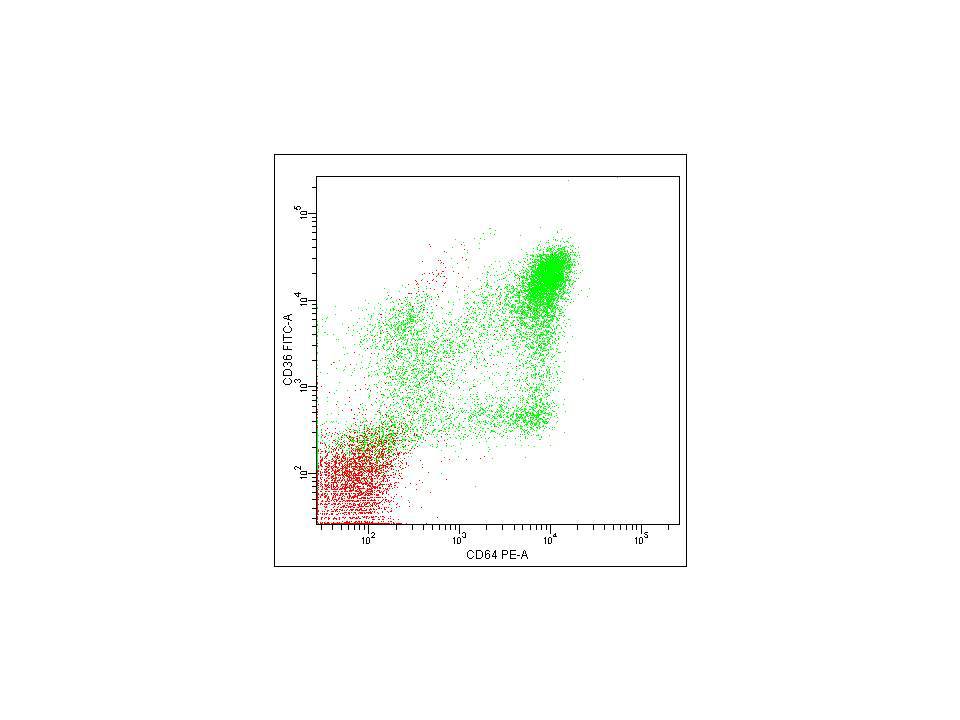 |
| Image 12 Flow cytometry |  |
| Image 13 CD7 | 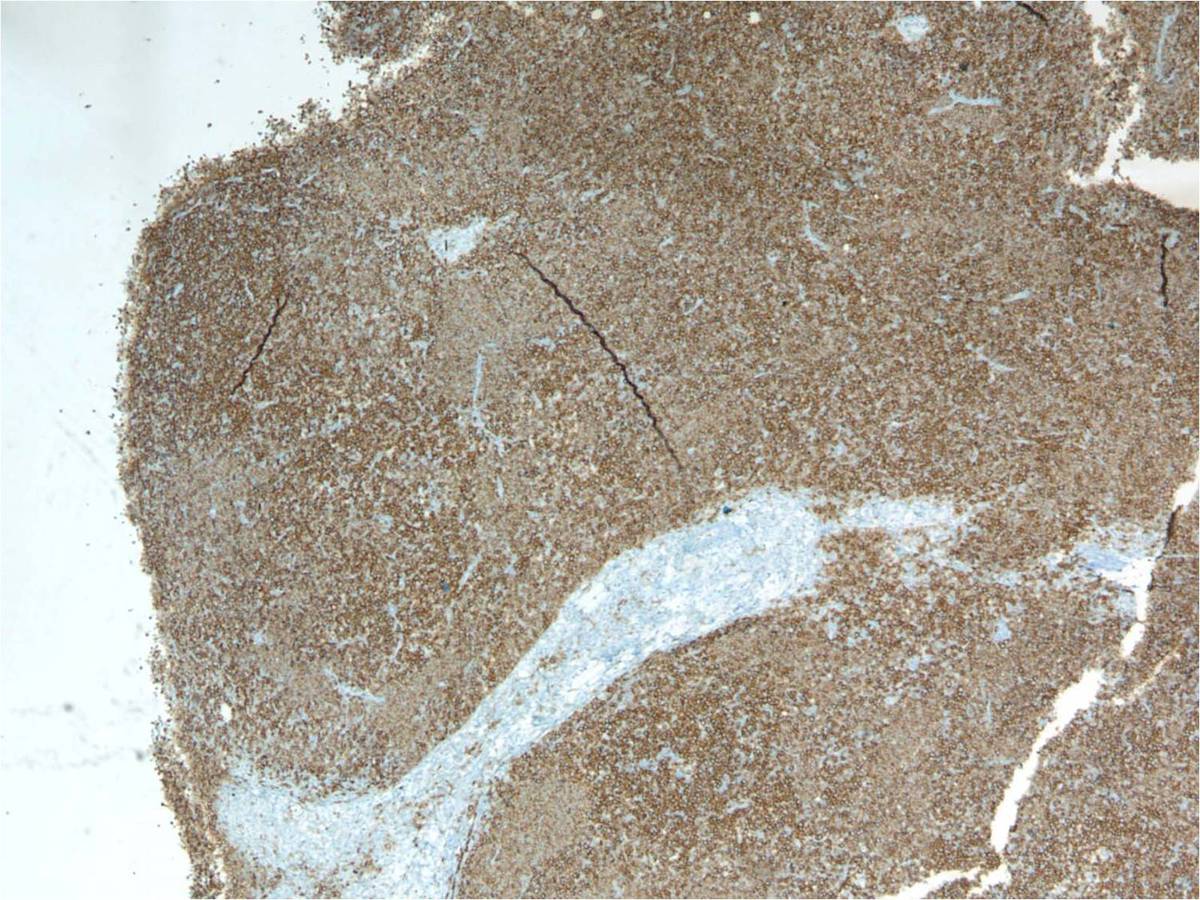 |
| Image 14 TdT |  |
| Image 15 CD68-PGM1 |  |
| Image 16 BCR-ABL1 FISH | 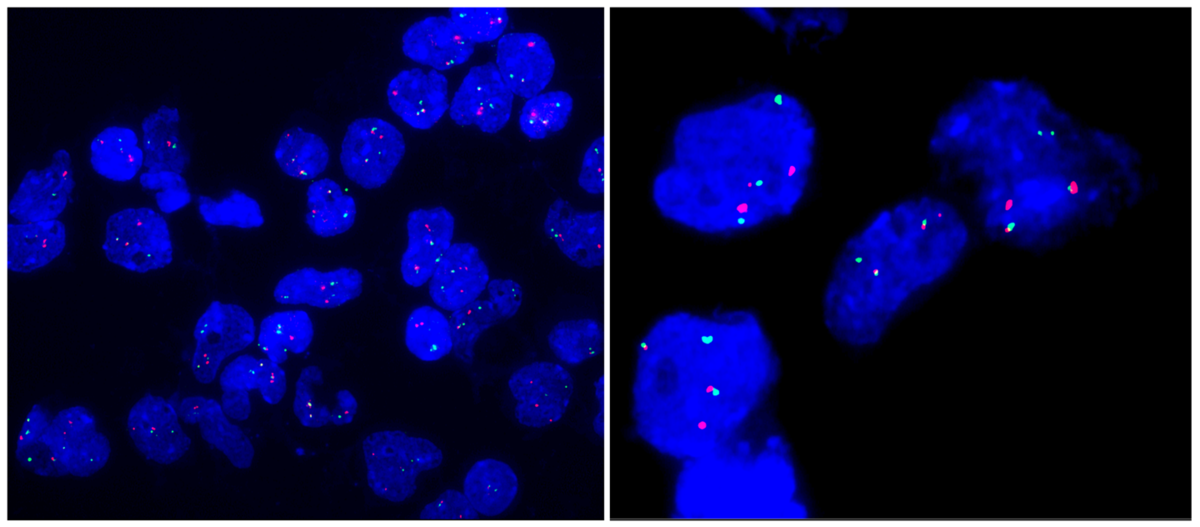 |